Standard observability breaks the moment you put an LLM in the loop. AI observability production requires a fundamentally different approach — one that treats model behavior as a first-class concern alongside infrastructure health. I learned this the hard way when a system I built started returning confident, well-structured, completely wrong answers — and none of my dashboards noticed.
This article covers the observability stack I’ve built for AI systems in production: what to trace, how to structure logs, where to set alerts, and why most APM tools miss the point entirely.
Why standard APM fails for LLM systems
I run Application Insights and Azure Monitor on every production system I build. They’re excellent at telling me when a service is slow, when an endpoint returns 500s, or when CPU spikes past a threshold.
They told me nothing useful when my LLM-powered system started hallucinating.
The failure was subtle. Latency was normal. HTTP status codes were all 200. Throughput was steady. From an infrastructure perspective, everything was healthy. But the model had drifted — a prompt that worked reliably for weeks started producing fabricated references in roughly 15% of responses. Users noticed before my monitoring did. That’s a monitoring failure.
Traditional APM is built around a simple model: requests come in, processing happens, responses go out. You measure latency, error rates, and resource consumption. The assumption is that if the infrastructure is healthy and the code doesn’t throw exceptions, the system is working correctly.
LLMs violate that assumption. A perfectly healthy API call can return a response that’s structurally valid, semantically coherent, and factually wrong. The HTTP layer has no idea. Your error rate stays at zero while your users lose trust.
The gap isn’t that APM tools are bad. They’re solving a different problem. AI observability production requires monitoring the content and quality of model interactions, not just the plumbing that carries them.
What I actually trace on every LLM call
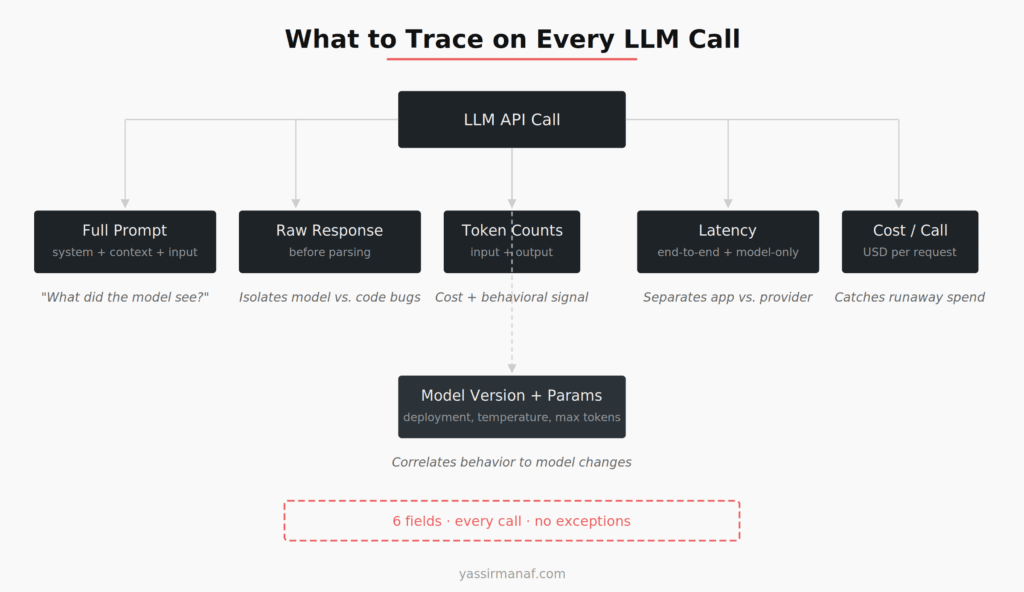
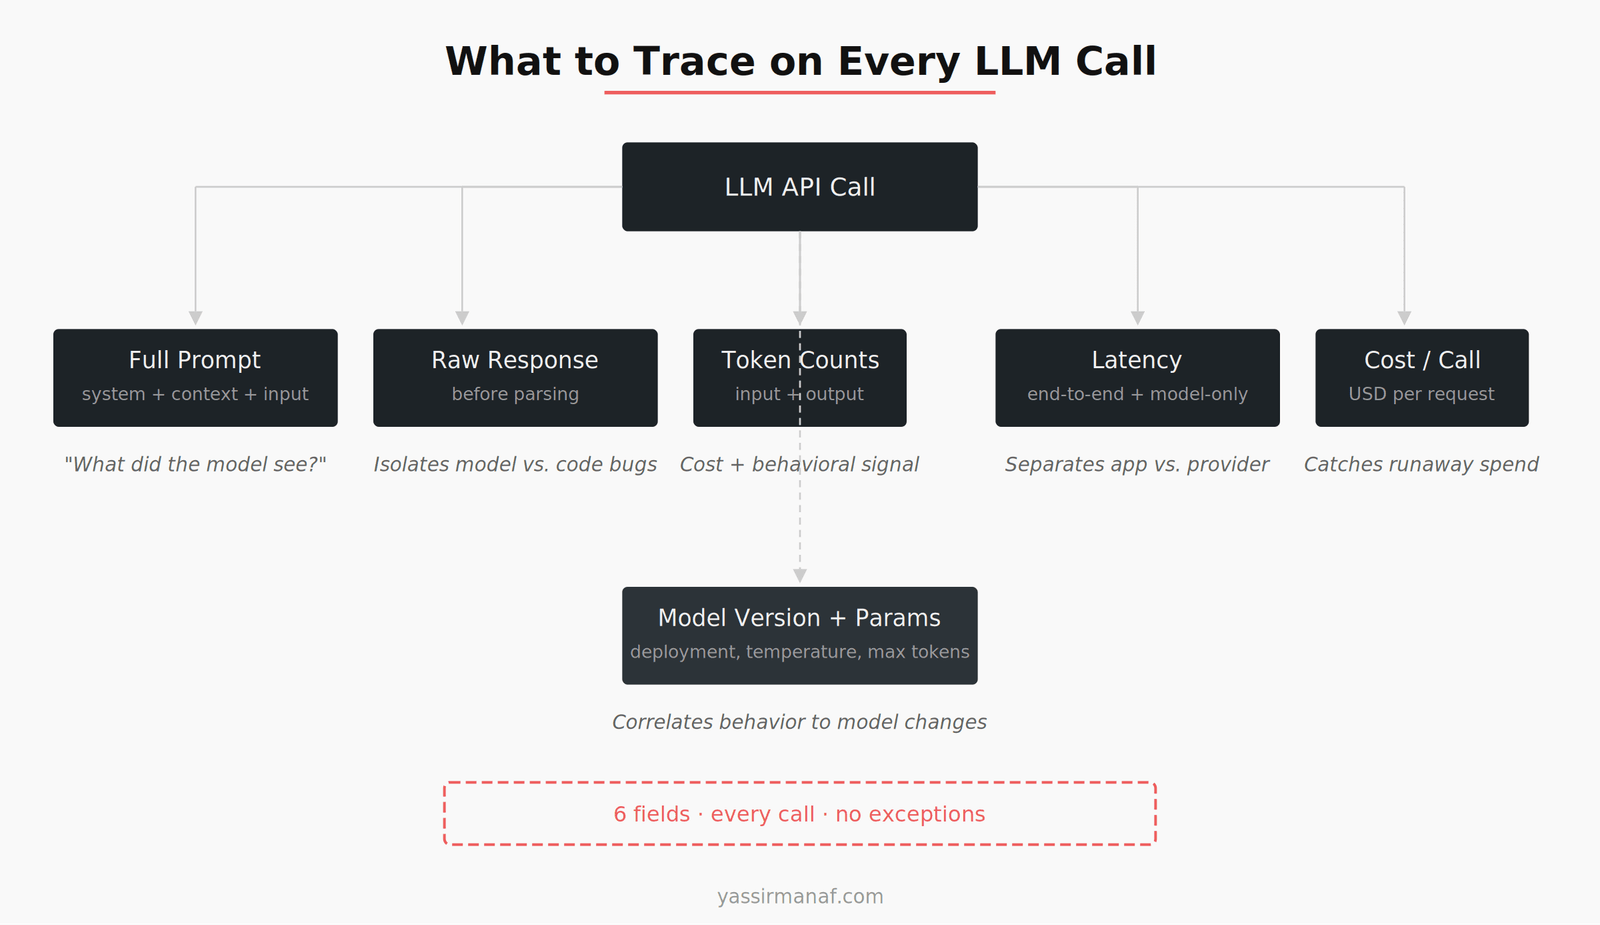
After the hallucination incident, I built a tracing layer that captures six fields on every single LLM call. No exceptions. Even in systems where I think the model is reliable, these get logged.
The full prompt sent to the model. Not just the user input — the complete prompt including system message, retrieved context, and any few-shot examples. When output quality degrades, the first question is always “what did the model actually see?” Without the full prompt, you’re debugging blind.
The raw response. Before any parsing, validation, or post-processing. I’ve had bugs where the model returned something reasonable and my parsing code mangled it. Without the raw response, I would have blamed the model for a code defect.
Token counts — input and output separately. This isn’t just for cost tracking (though that matters, and I wrote about the cost side in Azure Costs in AI Workloads). Token counts are a behavioral signal. If a response that usually runs 200 tokens suddenly comes back at 800, something changed. Either the prompt grew, or the model is being more verbose, or it’s generating filler. All of those warrant investigation.
Latency — end-to-end and model-only. I separate total request time from the time spent waiting for the model API. The gap between those two numbers is my application overhead — retrieval time, prompt assembly, response parsing. When latency spikes, I need to know which part is responsible without digging through spans.
Cost per call. Calculated from token counts and the model’s pricing tier. I log this on every call and aggregate it per feature, per user segment, per hour. A single LLM call is cheap. A thousand calls triggered by a retry loop someone forgot to cap is not. I caught a $400/day runaway cost issue because this field existed in my logs.
Model version and parameters. Temperature, max tokens, which model deployment served the request. When you’re running multiple model versions during a rollout — or when your provider updates a model under you — this field is the only way to correlate behavior changes to model changes.
Six fields. Every call. The storage cost is trivial compared to the debugging time they save.
Structured logging for AI pipelines
Most AI systems aren’t a single LLM call. They’re pipelines — retrieve context, build prompt, call model, validate output, maybe call the model again. I wrote about the validation piece in LLM Output Validation in Production. The observability challenge is tracing a single user request through that entire chain.
I use a correlation ID pattern, similar to what I described in How I Debug Distributed Systems, but adapted for AI pipelines. The approach borrows from OpenTelemetry’s distributed tracing model — every request gets a trace ID at entry, and every step in the pipeline logs against that ID with a stage identifier.
The structure looks like this:
trace_id: "abc-123"
stage: "retrieval"
duration_ms: 45
chunks_retrieved: 6
relevance_scores: [0.92, 0.87, 0.84, 0.71, 0.68, 0.55]
trace_id: "abc-123"
stage: "prompt_assembly"
duration_ms: 3
total_tokens_estimated: 2,847
context_window_utilization: 0.35
trace_id: "abc-123"
stage: "model_call"
duration_ms: 1,240
model: "gpt-4-turbo"
input_tokens: 2,891
output_tokens: 342
cost_usd: 0.041
trace_id: "abc-123"
stage: "validation"
duration_ms: 12
passed: true
checks_run: ["format", "length", "citation_present"]
Each stage is a separate log entry. This is deliberate. When something goes wrong, I don’t want to parse a giant nested object — I want to filter by trace ID and see the stages in order. When I need aggregate analysis, I want to query by stage across thousands of traces — show me all retrieval steps where fewer than 3 chunks scored above 0.8.
One thing I got wrong early: logging prompts as unstructured strings. A 3,000-token prompt dumped into a log field is useless for analysis. I now log prompts with metadata — system message length, number of examples, context token count, user input length — as separate numeric fields. The full prompt text goes to blob storage with a reference ID. The structured fields go to the queryable log store.
Alerting on model behavior in AI observability production
This is where most teams stop too early. They set up infrastructure alerts — latency above 5 seconds, error rate above 1%, cost above daily threshold — and call it done. Those alerts are necessary. They’re also insufficient.
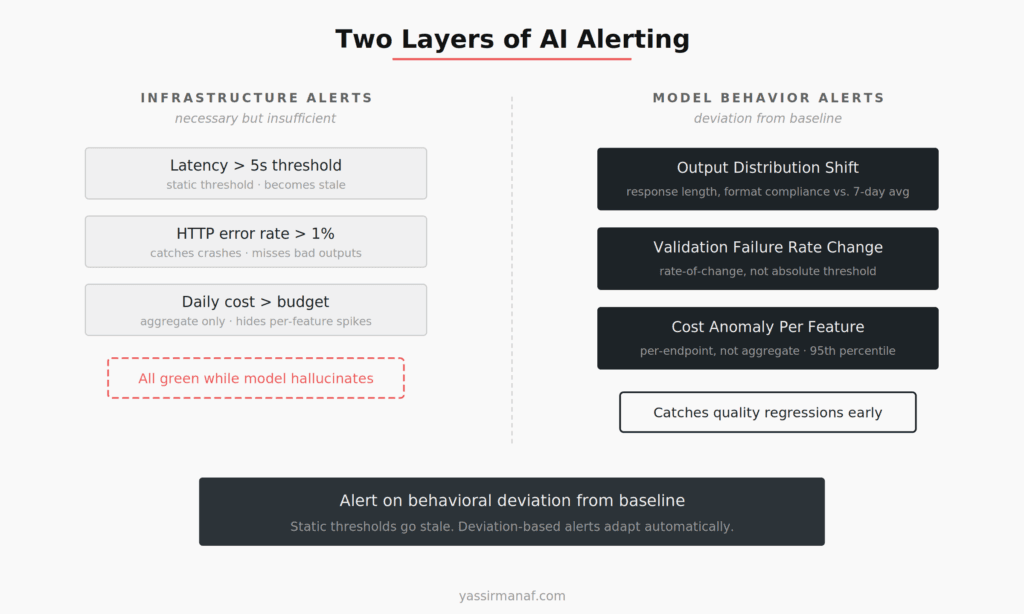
The alerts that have actually caught production issues for me fall into three categories that standard monitoring doesn’t cover.
Output distribution shifts. I track the statistical distribution of response characteristics — average token count, format compliance rate, confidence scores if the model provides them. When the 7-day rolling average of response length drops by 20% without a prompt change, something happened. Maybe the model provider updated weights. Maybe my retrieval pipeline is returning less relevant context. Either way, I want to know before users report it.
I set this up as a simple comparison: current hour’s average vs. trailing 7-day average for the same hour. If the deviation exceeds two standard deviations, I get an alert. Not a page — a Slack notification with a dashboard link. Most of these are benign. The ones that aren’t are worth catching early.
Validation failure rate changes. I run output validation on every response (format checks, length constraints, citation verification when applicable). A steady 2% failure rate is normal — models aren’t deterministic. A jump from 2% to 8% over a few hours is a signal. I alert on rate-of-change, not absolute values.
Cost anomalies per feature. Not total cost — cost broken down by feature or endpoint. A 3x spike in the summarization endpoint’s cost might be invisible in the total daily spend if it’s a small percentage of overall traffic. But it could mean a prompt regression that’s generating unnecessarily long outputs, or a retry loop, or a user abuse pattern. I aggregate cost per feature per hour and alert on anything above the 95th percentile of the trailing 30 days.
The principle behind all three: alert on behavioral deviation from baseline, not on absolute thresholds. An absolute threshold of “latency above 3 seconds” is static and eventually wrong — either too sensitive or too lax as your system evolves. A deviation-based alert of “latency 40% above your own trailing average” adapts automatically.
The tools I use for AI observability production
I’ve evaluated most of the tools in the AI observability space. Here’s where I’ve landed as of early 2025.
Azure Monitor + Application Insights handles infrastructure-level observability. I’m already on Azure for most deployments, and the integration with Azure OpenAI Service is decent for tracking API-level metrics — token usage, latency, HTTP errors. This is my baseline. It covers the plumbing.
LangSmith is the best dedicated tool I’ve used for LLM tracing. The trace visualization — seeing the full chain of retrieval, prompt assembly, and model call in one view — is genuinely useful for debugging. I use it in development and staging, and selectively in production for sampled traces. My hesitation with full production use is data residency — sending all prompts and responses to a third-party service isn’t always an option, especially with client data involved.
Custom structured logging is where most of my actual observability value comes from. I built a thin logging layer in C# that wraps every LLM call and emits the six fields I described earlier. The logs go to Azure Log Analytics, where I run KQL queries for analysis. The alerting rules I described run against this data. It’s not glamorous, but it’s the system I trust most because I control what gets captured and how it’s queried.
I tried building a custom dashboard early on and regretted it. Maintenance cost was high and the visualizations were mediocre. I switched to Grafana pointed at my Log Analytics workspace. Standard tool, custom data — that’s the balance I’ve found works.
What I don’t use: I don’t run a separate ML monitoring platform (Evidently, WhyLabs, etc.). Those tools are designed for traditional ML models where you’re tracking feature drift and prediction distributions across large datasets. LLM observability is a different shape — it’s about individual call quality, prompt-response dynamics, and cost per interaction. The overlap is smaller than the marketing suggests.
The dashboard I check every morning
My production AI dashboard has four panels. I’ve resisted adding more because every panel I add dilutes attention from the ones that matter.
Panel 1: Cost per hour, broken down by feature. Stacked area chart, 24-hour window. I scan for spikes. This has caught three separate incidents — a retry loop, a prompt regression that doubled output tokens, and a traffic pattern change from a new client integration.
Panel 2: P50 and P95 latency, model-call only. Not end-to-end — just the time waiting on the model API. This isolates provider-side performance from my application code. When Azure OpenAI has a slow period, I see it here without noise from my retrieval layer.
Panel 3: Validation failure rate, 1-hour rolling. Single line chart. The number is usually boring. When it’s not boring, it’s urgent.
Panel 4: Token utilization — context window usage as a percentage. This one is less obvious but has been valuable. When my retrieval pipeline starts stuffing too much context into the prompt, responses degrade. I keep a target of 40–60% context window utilization. Below 40% means the retrieval probably isn’t finding enough relevant content. Above 70% means the model is running out of room to reason. Both are worth investigating.
Four panels. Takes me 30 seconds most mornings. When something looks off, I have the structured logs to drill into.
What I’d build differently next time
If I were starting from scratch today, I’d invest earlier in two things I bolted on later.
First, automated prompt regression testing tied to observability. Right now, when I detect a quality degradation, I manually investigate whether a prompt change caused it. A better system would tag each deployment with its prompt version and automatically correlate quality metrics to prompt changes. I’m partway there — the model version field in my traces helps — but prompt versioning as a first-class observability dimension is something I had to learn the hard way, as I described in my first LLM in production.
Second, user-feedback integration into the alerting pipeline. I collect feedback when users flag bad responses, but it feeds into a product analytics dashboard, not the observability stack. Those two systems should be connected. A spike in negative feedback that correlates with a cost anomaly and a validation rate change tells a much clearer story than any of those signals alone.
AI observability production isn’t a solved problem. The tooling is immature compared to traditional APM, and most teams are still figuring out what to measure. But the core principle is the same one that applies to any production system: if you can’t see it, you can’t fix it. For AI systems, “seeing it” means looking past the infrastructure and into the model’s actual behavior.
Measure the output. That’s where the failures hide.
Building observability for AI systems? I’d like to hear what signals you’re tracking. Find me on LinkedIn.
Leave a Reply