Debugging distributed systems is a different discipline. The error you’re looking at isn’t the error that matters. The failure is usually two hops upstream, in a service you didn’t think to check, logged at a severity level that didn’t trigger any alerts.
I’ve spent years debugging production incidents across distributed .NET services on Azure. This isn’t a tools survey. It’s the actual workflow I follow — the mental model, the non-negotiables, and the decisions that let me get to root cause in under an hour instead of spending a morning staring at log streams that don’t connect.
The Mental Model: Follow the Request, Not the Stack Trace
In a monolith, a request is a call stack. You trace it from entry to exit in one process. In a distributed system, a request is a transaction that touches multiple processes, multiple queues, multiple databases — each of which logs separately, fails separately, and recovers separately.
Your job isn’t to find the error. Your job is to reconstruct the request journey.
Once you can see the full path of a specific request across every service it touched, the error becomes obvious. It always is, in hindsight. Every debugging tool and practice I use is in service of this one goal: see the full journey of a specific request across the full system.
That reframe changes everything. You stop jumping to the service that surfaced the error and start asking where the request actually broke down. Those are rarely the same place.
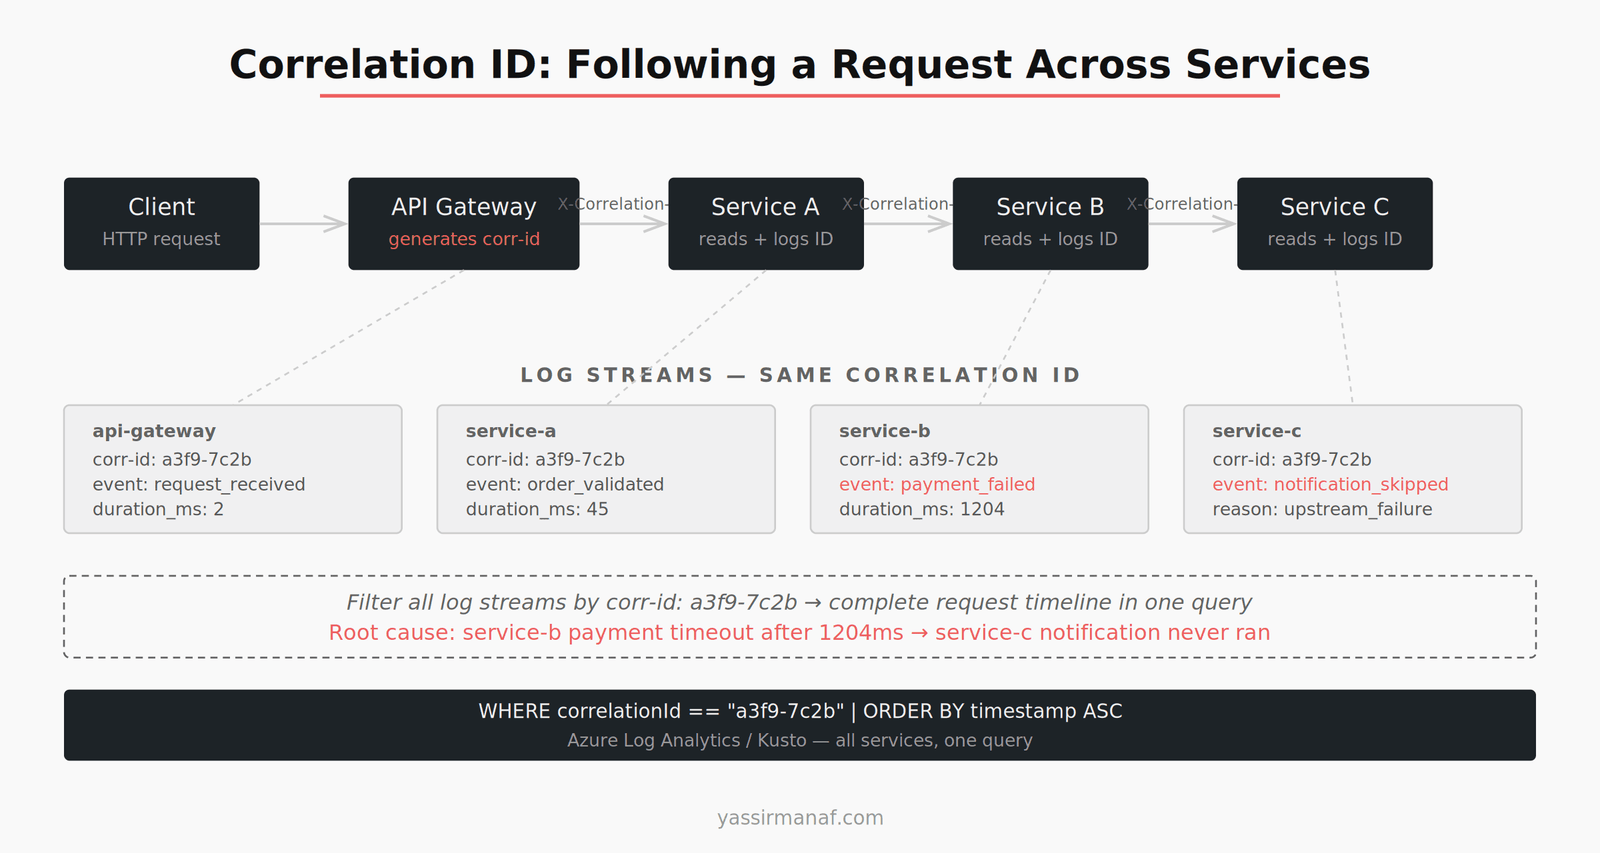
Correlation IDs: The One Non-Negotiable
If your distributed system has one thing, make it correlation IDs.
A correlation ID is a unique identifier generated at the entry point of a request — the API gateway, or the first service in the chain — and propagated through every downstream service call, every queue message, every async worker. Every log line includes it. Every error references it.
When something breaks, I start here. Find the correlation ID from the failed request — from a client error log, from an alert, from a user report — and filter every log stream to that ID. In minutes I have the complete story of what that request did across the system.
Without correlation IDs, debugging a distributed failure is archaeology. You’re reconstructing events from fragments, guessing at causality, hoping timestamps align well enough to build a coherent sequence. That’s not debugging. It’s detective work with bad evidence.
In .NET, the implementation is a few hours of work. Add middleware that reads an X-Correlation-ID header (or generates one if absent) and stores it in HttpContext. Use a Serilog enricher or a custom logging scope to attach it to every log entry automatically. Pass it downstream in HTTP headers and inside every message you publish to a queue.
The implementation cost is low. The operational benefit lasts for the life of the system.
Structured Logging: Logs as Data, Not Strings
Structured logging is not prettier log messages. It’s treating log entries as queryable records instead of text output.
The difference matters in practice. Unstructured logging gives you:
2024-08-01 14:23:11 INFO Processing order 4821 for customer 991
Structured logging gives you a JSON object with fields: orderId, customerId, correlationId, service, duration_ms. In Azure Log Analytics or Seq, you can now filter, group, and aggregate on those fields. “Show me all requests where payment processing exceeded 2 seconds” becomes a field filter, not a string parse.
In .NET, Serilog with structured output handles this. Configure it once, use it everywhere, and make sure every log entry carries: correlation ID, entity identifiers relevant to the operation, the duration of any external call made, and the outcome.
Two fields most teams skip that account for the majority of debugging I do:
Time spent on external dependencies. How long did the database query take? How long did the downstream service call take? Without this, you know something was slow — you don’t know where.
The eventual outcome of async operations. A message was published. Did the consumer process it? Did it succeed? This closes the loop on every async flow you instrument.
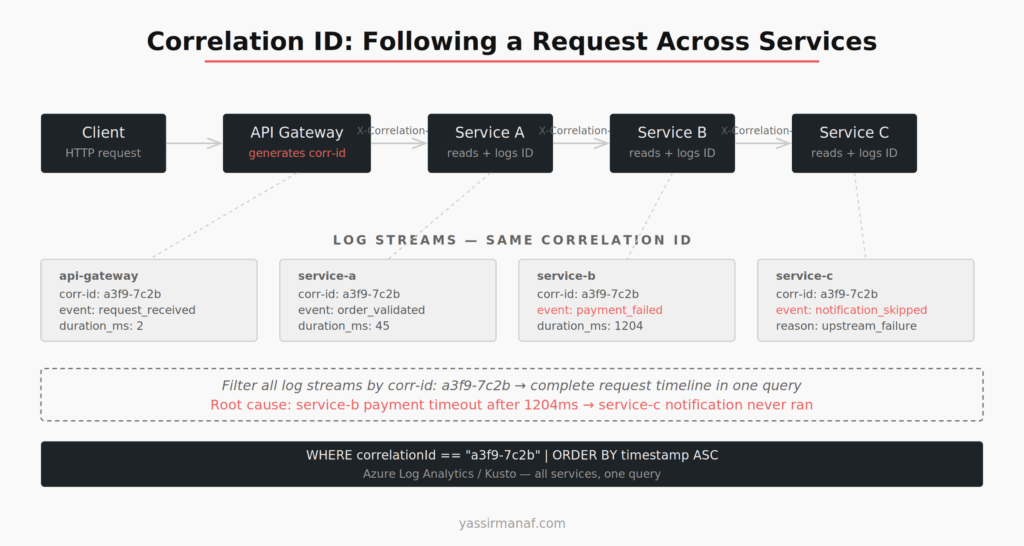
Log Aggregation: Get Out of Individual Service Logs
Local service logs are a dead end when you’re chasing a distributed failure. You need a single place to query across all services simultaneously.
On Azure, Log Analytics with a shared Workspace is where everything goes — structured logs from every service, exceptions, custom events, dependency traces. A single Kusto query can pull correlated events across ten services in the same time window. Filter by correlation ID, order by timestamp, and you have the full request timeline.
One configuration detail that bit me: all services must use UTC timestamps, and you need to monitor clock skew. I once spent 40 minutes untangling a “causality violation” where service B appeared to respond before service A sent the request. One container had drifted 40 seconds. Not a bug in the code. A misconfigured clock.
The fix: enforce UTC across the stack and set up an alert when any service’s reported time diverges from the baseline by more than a few seconds. It’s a boring piece of infrastructure that saves expensive debugging sessions.
Distributed Tracing: When Logs Aren’t Enough
Structured logs with correlation IDs get you through most incidents. Distributed tracing gets you through the rest.
Tracing — via OpenTelemetry or Application Insights distributed tracing — captures the parent-child relationship between spans across services. You see not just that service B was called, but that it was called from service A, in the context of request X, and that it took 340ms of the total 800ms request duration.
The visual trace waterfall is what matters. It turns a flat timeline of log entries into a causality graph. You can see which services ran in parallel, which ran sequentially, which one was the bottleneck, and where a 5ms call became a 400ms call because something upstream was holding a lock.
I reach for tracing when the logs tell me something is slow but not why, or when a failure is non-deterministic and I need to see the execution pattern across many requests. For straightforward failures — a service returning 500, a message going to the dead letter queue — structured logs with correlation IDs are faster.
In .NET, OpenTelemetry integrates with ASP.NET Core, HttpClient, Entity Framework, and most Azure SDKs with minimal configuration. Most instrumentation is automatic. The discipline is in wrapping your own custom operations — background jobs, queue consumers, manual HTTP calls — in named spans so the trace is complete.
Reproducing Failures Locally
The fastest debugging loop is local. Production logs tell you what happened. Local reproduction tells you why.
The challenge in a distributed system is that “local” means multiple services. I maintain a Docker Compose file in every project that brings up the full stack: all services, a local message broker, a local database. It isn’t production-identical, but it’s close enough to reproduce most failure classes.
The workflow: identify the failing request from production logs, grab the correlation ID, extract the input payload from the entry point log, replay that payload against the local stack. Eighty percent of the time the failure reproduces immediately. The other 20% is timing-dependent — race conditions, message ordering, infrastructure-specific quirks. For those, I add instrumentation, deploy to production, and wait for the next occurrence.
One deliberate choice: I don’t try to reproduce failures in staging. Staging environments are just different enough from production that the failure often doesn’t reproduce, which leads you to close the issue with “works in staging” rather than understanding it. I prefer the honest answer of “can’t reproduce locally, need more instrumentation” over a false staging success.
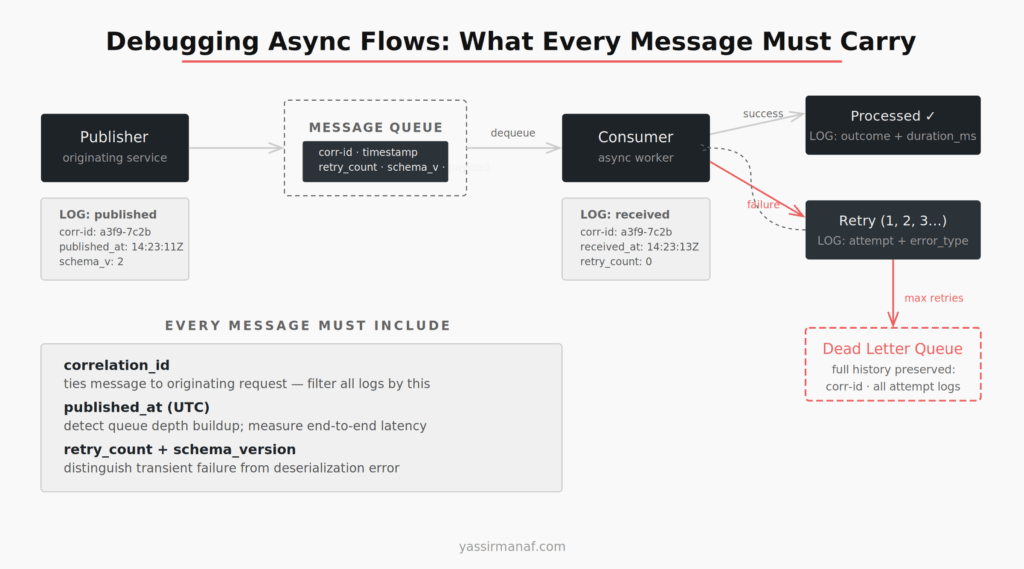
Debugging Async and Queue-Based Flows
Async failures are the hardest category. A message goes onto a queue, a consumer processes it asynchronously, something fails — and the originating request is long gone. No stack to trace. No immediate error to catch.
The key insight is that async flows need explicit observability hooks that synchronous flows don’t require. Every message I publish carries: the correlation ID from the originating request, a published timestamp, a retry count, and a schema version. Every consumer logs on message receipt, on processing success, and on failure — with the full message metadata attached.
When a message ends up in the dead letter queue, I can reconstruct its full history. When it was published. How many processing attempts it went through. What the failure was at each attempt. What the original request looked like. That reconstruction is only possible if the message was designed to carry that information from the start.
I covered the operational realities of queue-based systems in detail in an earlier post. The debugging patterns here depend entirely on having that observability foundation in place before you need it.
My Debugging Distributed Systems Sequence
When a production incident lands, I follow the same steps every time. Muscle memory matters during an incident — you don’t want to be deciding where to look while something is on fire.
1. Get the correlation ID. From the alert, the client, or the entry point logs. Always first.
2. Filter the log store. One Kusto query, all services, that correlation ID. See the full request journey.
3. Find the first failure. Not the last error — the first one. Everything after the first failure is usually consequence, not cause.
4. Narrow to the failing service. Look at that service’s logs for that request in detail. What did it call? What was returned? How long did each dependency take?
5. Check dependencies. Was the failure in the service itself, or in something it called? Database, downstream service, external API? Dependency logs and traces answer this.
6. Reproduce locally if possible. Replay the input from the entry point log.
7. Fix and add instrumentation. Whatever the fix, add one log line or metric that would have made this obvious from step two. Every incident should make the next one faster.
The full sequence — alert to root cause — takes around 20 minutes when the instrumentation is solid. Without it, the same incident takes three hours and ends with “we think it was probably X.”
Simplicity Still Applies
The temptation in distributed systems observability is to add more: another dashboard, another tracing tool, another alert. The instinct is that more signal means fewer blind spots.
The actual leverage is in fewer, better-configured tools with complete coverage. One log aggregation platform that every service ships to, consistently formatted. One correlation ID scheme that every service respects. One tracing setup with good span naming across the full stack.
I’ve worked in systems with eight different logging configurations across twelve services, half of which didn’t propagate correlation IDs, and a tracing setup that covered four of twelve services. Those systems are painful to operate — not because distributed systems are inherently hard, but because nobody made the boring consistency decisions early.
Choosing simplicity over engineering applies to observability just as much as it applies to architecture. A simple, complete setup beats a sophisticated, partial one every time.
What’s the incident that taught you the most about distributed observability? Find me on LinkedIn.
Leave a Reply