
Message queues solve a legitimate problem: decoupling producers from consumers so neither side blocks the other. Kafka, RabbitMQ, Azure Service Bus — these are real tools that handle real scale in message queues production environments.
The mistake I see most often isn’t choosing the wrong tool. It’s adding a queue because async feels more scalable than sync, and distributed sounds more serious than simple. That instinct costs teams months of operational pain they didn’t budget for.
Message queues in production are not a drop-in upgrade. They’re a system. And systems have failure modes.
The appeal is real — and so is the operational cost
The pitch is compelling. Your API doesn’t wait for downstream processing. Services scale independently. If a consumer is slow, the queue absorbs the backlog. It sounds like free capacity.
It’s not free. Every queue you add comes with a monitoring surface you didn’t have before: consumer lag, dead letter counts, retry rates, partition health (if you’re on Kafka), message age, and throughput per consumer group. You need to watch all of it. Not because you’re being thorough — because any one of those metrics going wrong is an incident.
I worked on a project where the team added Azure Service Bus to handle document processing. The integration took three days. The observability setup took three weeks. When the first real incident hit — a consumer crashing silently after a dependency update — we spent six hours debugging something that would have been a five-minute stack trace in a synchronous system.
That’s the cost every tutorial skips.
The other hidden cost is cognitive load. Async systems don’t fail visibly. A message is published, processed somewhere later, and if something goes wrong in between, the correlation is not obvious unless you built explicitly for it. Developers used to synchronous request/response underestimate how different async debugging actually is until they’re inside it.
There’s also the onboarding cost. A new engineer joining a team with a queue-based system needs to understand the tool, the consumer framework, the retry policy, the DLQ strategy, the schema format, and the observability setup before they can safely touch anything. A new engineer joining a team with a synchronous service needs to understand the service. That difference compounds every time someone new joins the team.
The failure mode that breaks everything: retry storms
Here’s how retry storms happen. A downstream service slows down — maybe a database is under load, maybe a third-party API is degraded. Your consumer starts timing out. The retry policy kicks in.
If your retry policy is naive — fixed interval, no jitter, aggressive count — you now have thousands of messages retrying on the same schedule. Every retry hits the downstream service simultaneously. The downstream service, already struggling, gets hammered. It fails completely.
Now the cascade: queue is backed up, consumer is failing, downstream service is down, and every retry attempt is making recovery harder. The queue, which was supposed to isolate the failure, has amplified it.
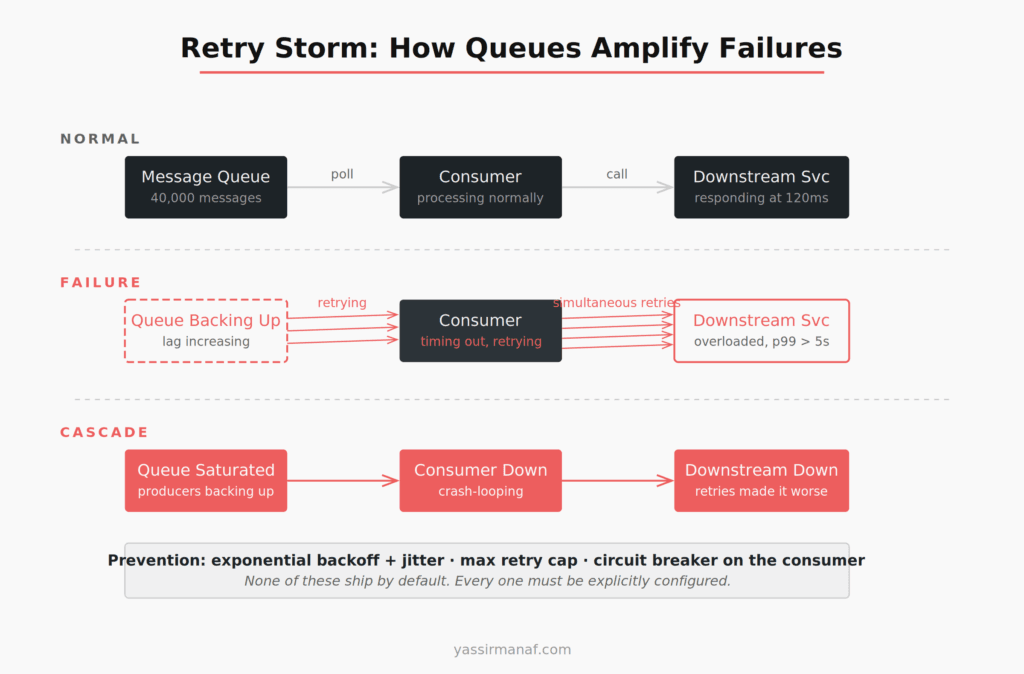
This is not a misconfiguration. It’s the default behavior of most queue setups when nobody explicitly designs for failure. The fixes exist — exponential backoff with random jitter, max retry caps, circuit breakers in the consumer — but none of that ships by default and none of it is in the quick-start guide.
Azure Service Bus gives you MaxDeliveryCount. RabbitMQ gives you x-max-retries. Kafka doesn’t have server-side retry at all — you implement it yourself in the consumer. Every tool is different. Every default is dangerous until you know what it is.
Poison messages: the silent killer
A poison message is a message your consumer can’t process. Wrong format, unexpected null, a schema change that wasn’t backwards-compatible. The consumer fails on it, retries it, fails again — until it exhausts the retry count or blocks the queue entirely.
I inherited a system where a single malformed event from a third-party integration had been retrying for six days. Consumer throughput had dropped to 30% of normal. The monitoring showed elevated processing time but no exceptions — the failed retries were consuming cycles without surfacing as errors in the dashboards we’d configured.
Finding the cause took three hours. Fixing it took twenty minutes: a dead letter queue configuration that should have been there from day one.
The lesson isn’t that the third party sent bad data — that’s expected and should be planned for. The lesson is that the system had no mechanism to say “this message is unprocessable, set it aside, and keep going.” Without a DLQ, a single bad message is an incident waiting to happen.
Dead letter queues: configure them first, not last
A dead letter queue holds messages that failed to process after hitting the maximum retry count. It’s the safety net that prevents one bad message from blocking everything behind it.
Every queue running in production needs a DLQ configured before the consumer goes live. Not after the first incident. Day one.
The harder part: the DLQ itself needs to be monitored. An unmonitored DLQ is a graveyard. Messages accumulate, nobody sees them, and the business silently loses events while every dashboard shows green. I’ve seen this at more than one company. In one case, six weeks of failed payment events had been quietly accumulating in an unmonitored DLQ. The team discovered it during a quarterly reconciliation. <!– IMAGE: diagram-dlq-flow.png –>
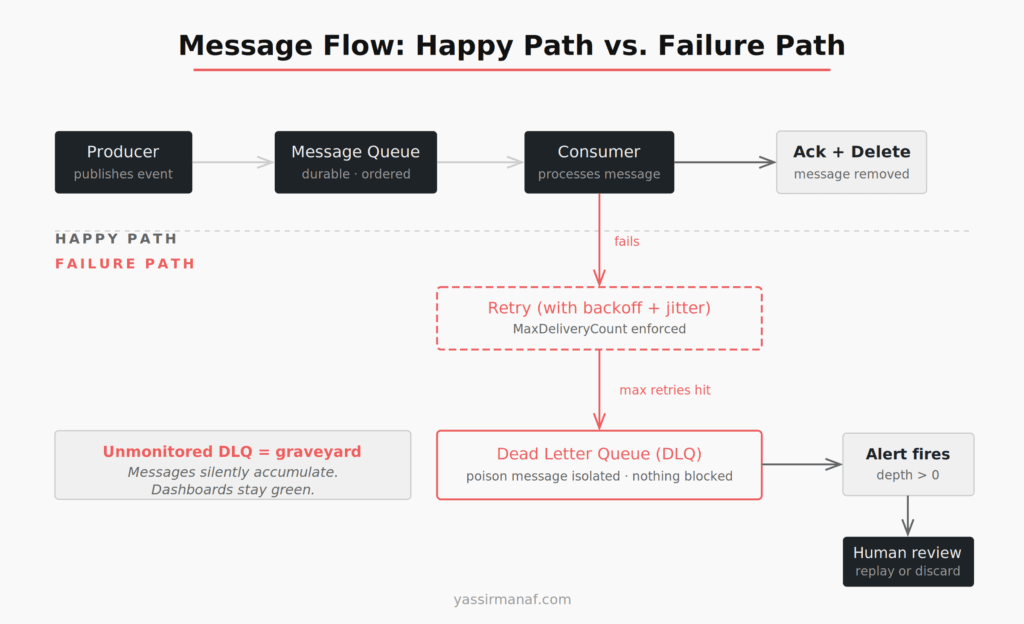
The minimum DLQ setup that’s actually usable: an alert on DLQ depth greater than zero, a documented process for reviewing and replaying or discarding failed messages, and a runbook that treats the DLQ as a first-check during any incident investigation. Without an alert, the DLQ is cosmetic.
Async debugging is a different skill set
Synchronous systems fail visibly. A request fails, an exception propagates, you get a stack trace. The correlation between the action and the failure is right there.
Async systems don’t work that way. A message is published at 10:15. It’s consumed at 10:17. The consumer calls a downstream service, which fails. The failure is logged — somewhere. The retry happens at 10:23. If your correlation IDs aren’t propagated across the message boundary, you’re reconstructing a sequence of events from multiple log streams with different timestamps and no guaranteed ordering.
I’ve spent entire afternoons doing this reconstruction work. It’s not a skills problem. It’s an infrastructure problem that looks like a skills problem.
Distributed tracing is not optional once you introduce a queue. Every message needs a correlation ID generated by the producer, attached to message headers, read by the consumer, and propagated through every downstream call that consumer makes. Structured logging needs to include that ID on every log line. Your tracing tool — OpenTelemetry, Application Insights, Datadog, whatever you’re running — needs to stitch the trace across the async boundary.
Without that, debugging a production issue is archaeology. You’re digging through logs trying to match which message caused which failure, hoping timestamps are close enough to make the sequence plausible.
Get the observability in place before the first consumer goes to production. It cannot be retrofitted under pressure at 2am.
When message queues actually make sense
I’m not arguing against queues. I’m arguing against using them by default.
Fire-and-forget processing where the caller doesn’t need a result. Email delivery, PDF generation, thumbnail processing, report compilation — the request thread shouldn’t wait for any of this. Queues fit naturally here. The alternative is blocking the thread or building a custom async job infrastructure from scratch, which is often worse.
Load leveling for predictable spikes. If your system processes 300 requests per minute normally but spikes to 3,000 during business hours, a queue lets you smooth that curve without scaling the consumer 10x. The queue absorbs the spike. The consumer processes at its own rate. That’s the pattern queues were designed for, and it’s a genuine win when the spike profile is real and measured.
Cross-team or cross-system contracts. When the producer and consumer are owned by different teams with different deployment schedules, a queue gives them a stable contract without tight coupling. One team deploys without coordinating with the other. Real benefit — but it requires real organizational separation. I’ve seen queue boundaries drawn for teams that were planned, approved, and never hired.
Event log and replay with Kafka. Kafka specifically stores events as a durable, replayable log. If you need to reconstruct state after a bug, re-process events after a migration, or audit every state change for compliance, that capability is worth the operational overhead. Kafka’s documentation on log compaction explains why this retention model is fundamentally different from a traditional queue. But it’s a specific need with a specific justification — not a default reason to choose Kafka over simpler options.
Every justification above names a concrete, present-tense problem. Not “we might need this at scale.” A problem that exists right now.
Two questions before adding any queue
Can a database table and a background job solve this?
If you need async processing and don’t require real-time consumption, a table with a status column and a scheduled worker handles a surprising amount of queue use cases. It’s monitorable with SQL. It’s debuggable with a WHERE clause. Retries are a column update. The DLQ is another status value. You lose operational elegance, but operational elegance doesn’t page you at 2am.
The transactional outbox pattern formalizes this approach: write events to a database table in the same transaction as your business data, then a relay process publishes them to the queue (or to consumers directly). It gives you exactly-once semantics without distributed transactions. For many systems, it’s the right answer and teams skip straight past it to Kafka.
This isn’t always the right answer. It’s the right question to start with. If you can’t name a concrete reason the outbox pattern won’t work here, you might not need a queue yet.
Have I designed for failure before writing the first consumer?
This means: DLQ configured and alerting. Retry policy with jitter and a hard max count. Circuit breaker on downstream calls inside the consumer. Correlation IDs on every message and propagated through every log line. Consumer idempotency guaranteed — because messages can and will be delivered more than once, and your consumer must handle that without corrupting state.
If any of those are missing, the queue isn’t production-ready. Add them before the first message goes live, not after the first incident forces you to.
Queues look simple from the outside. The failure modes are invisible until you’re inside one. And by the time you’re inside one at 2am, the only thing that separates a quick fix from a six-hour incident is whether you built the observability in advance.
What’s the worst queue-related incident you’ve dealt with in production? Find me on LinkedIn.
Leave a Reply